Is FMI’s 2.1 percent my grocery store’s SDE?
No. It is average net profit for food retailers in FMI’s 2025 sample. SDE puts owner pay and true one-time items back into cash. Net is after the living came out.
Grocery Store Business Broker · HedgeStone Business Advisors · Jason Taken
Last updated 2026-09-04
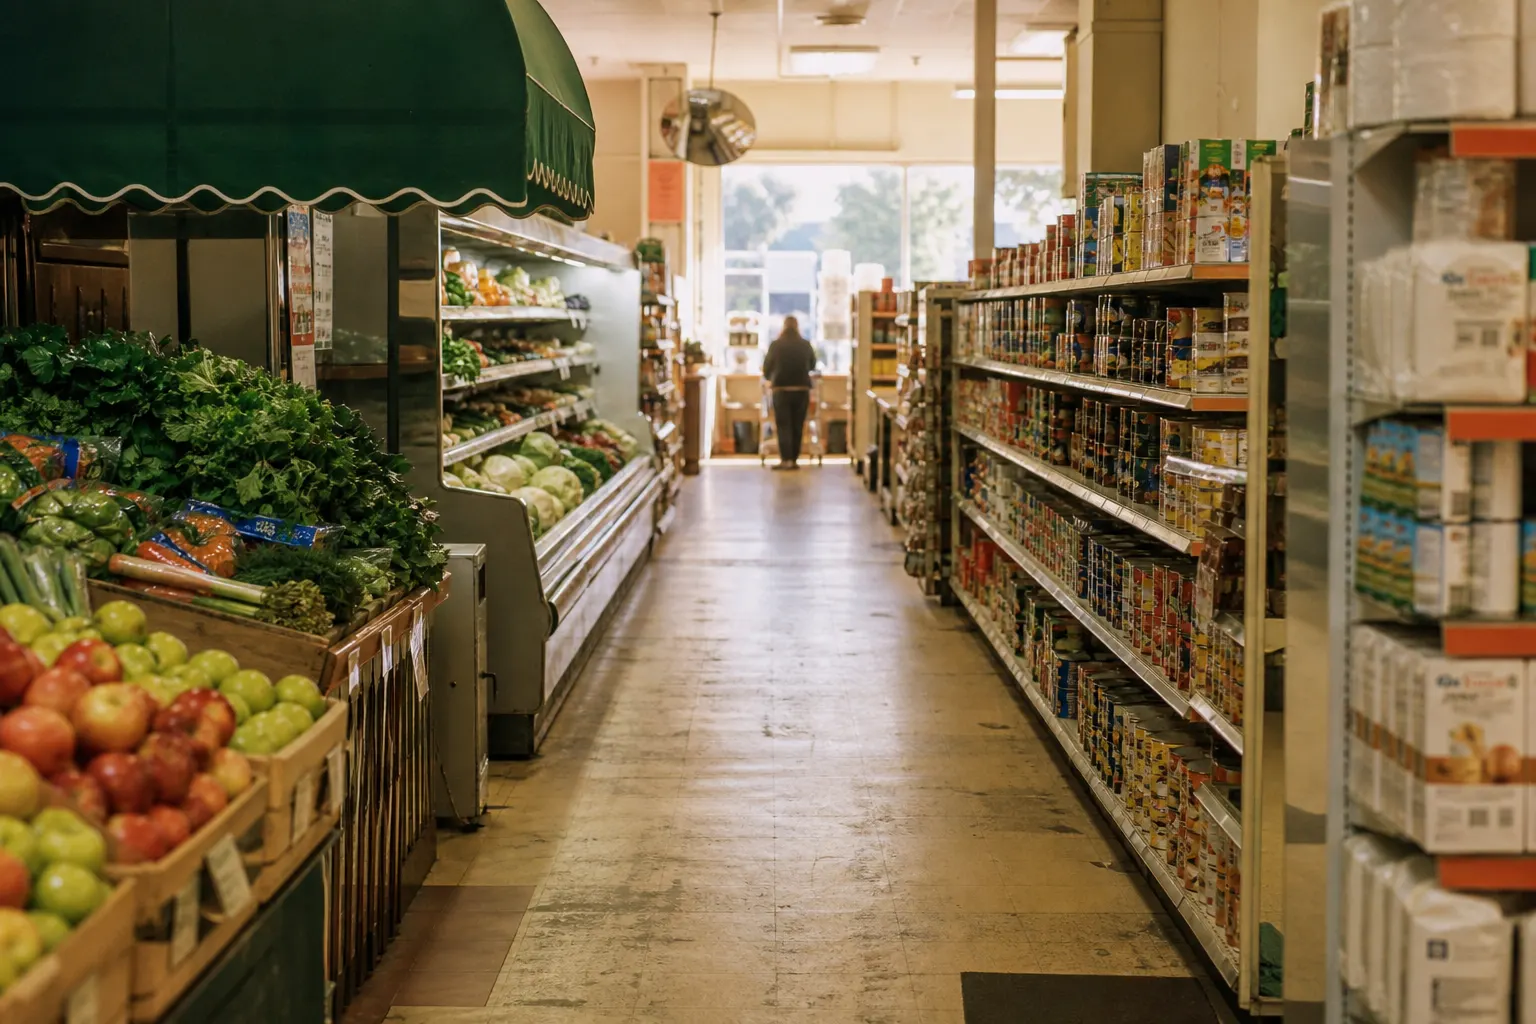
Net margin — Bottom-line profit as a percent of sales after operating costs. FMI publishes a 2.1 percent average net profit for food retailers in 2025 on its Food Industry Facts page. That number is food-retailer net in FMI’s Speaks sample. It is not your store’s SDE. Independent 1 to 3 percent talk is a commonly cited working range in trade conversation. It is not an official NGA primary statistic in this research pack.
Print the SDE worksheet next to the tax return. Grocery Store Business Broker — HedgeStone Business Advisors, led by Jason Taken — will not multiply a net percent and call it a grocery price. Book a confidential intro when you want the living restored to cash, then compared with that thin industry net.
Gross margin stops at cost of goods. Net keeps going: occupancy, labor, insurance, interest if it sits on the P&L, and whatever the owner took as a W-2. A rural independent clearing a thin net can still be a living if sales are large enough and the building is paid for. That living may be hiding in related-party rent, a personal auto, and unpaid family hours. Those are add-backs when they leave with the seller. They are the business when a buyer must replace them. Recasting a grocery P&L is how you find out which is which. How much does a grocery store owner make is the owner-cash question. This page is the net-versus-SDE fork.
EBITDA shows up when a hired general manager already runs the box. Owner-operated neighborhood stores usually stay on SDE. SDE versus EBITDA for grocery is that split. Do not mix a food-retailer net sample, an owner SDE, and a firm EBITDA on the same CIM page.
FMI’s 2.1 percent is a food-retailer net profit average for 2025. It reminds you grocery is thin after the whole income statement. It is not a department target. It is not a multiple. It is not this 8,000-square-foot box. FMI also publishes supermarket scale on the same facts page: about $1 trillion in 2025 supermarket sales, 45,575 stores in the 2024 count, average weekly sales of $668,377, and $19.59 per square foot of selling area. Those are channel facts. They explain why a small net percent can still be a large living at supermarket volume. They do not set your valuation.
Do not present 1 to 3 percent as an NGA census of independents. Until an NGA or FMI independents table is attached to this pack, treat that range as conversation, not as a sourced table. What is a good profit margin should be answered with this store’s recast, not with a copied range.
BizBuySell’s 2025 grocery and supermarket sold sample shows an average earnings multiple of 3.38, a five-year average of 2.66, an interquartile range of 1.60 to 3.15, and a 2025 average revenue multiple of 0.43. Those earnings multiples attach to recast earnings, not to tax-return net and not to FMI’s 2.1 percent. Multiplying a thin net percent by sales is a revenue-multiple costume. Return to SDE. Then book the recast hour. Bring P&Ls, the owner’s pay, and an honest note about family hours. The conversation is cash one operator can keep, not a food-retailer average wearing your banner.
Price language for Grocery net margin versus SDE is (recast SDE x a defendable multiple) + inventory at cost, plus or minus lease and license risk. The table is one consistent example for this URL.
| Input or output | Illustrative figure |
|---|---|
| Weekly sales (illustrative) | $141,000 |
| Annual sales | $7,332,000 |
| Recast SDE | $425,256 (5.8% of sales) |
| Inventory at cost | $523,714 (~14 turns) |
| Occupancy check | $249,288 / year (3.4% of sales) |
| Low going-concern | $1,310,438 at 1.85x SDE + inventory |
| High going-concern | $1,671,905 at 2.70x SDE + inventory |
| Sketch DSCR on a note | 1.51 |
Rent at 3.4% of sales is the occupancy check. If the real lease is higher, the SDE in this table is too generous until you recast to market rent.
Book the intro call with your side of the table ready: seller files or buyer capital. The calendar is the only next step.
Print these, mark them up, and bring the marked copy to the intro. They are educational. They are not a valuation letter and not a listing. All downloadable guides.
Have the file ready so the hour is a recast, not a scavenger hunt. Then pick a time.
Get a specialist on the other side of the table
Grocery deals turn on licenses, inventory, and a recast a lender will believe. Book the intro and bring the file.
Book an Intro Call With Jason TakenNo. It is average net profit for food retailers in FMI’s 2025 sample. SDE puts owner pay and true one-time items back into cash. Net is after the living came out.
Not from this pack. That range is commonly cited in trade talk. It is not an official NGA primary table here. Use FMI’s 2.1 percent as food-retailer net context only.
Because the owner may have taken pay as rent, a low W-2, and family hours. Recast SDE can look healthier than tax net. The reverse is also true.
They attach to recast earnings in the grocery sold sample, not to a tax-return net percent. Do not multiply FMI’s 2.1 percent and call it a price.
Start a confidential grocery conversation
Whether you are exiting or acquiring, pick a time and we will talk through the file.
Book an Intro Call With Jason TakenThis page is educational information from Grocery Store Business Broker (HedgeStone Business Advisors). It is not legal, tax, or investment advice. Licensing, tax, and financing rules vary by state and deal. Confirm every item with counsel and your lender before you sign.
Ready when you are. Jason Taken will talk through the file.
Book a confidential intro